Decibel Therapeutics
January-June 2019
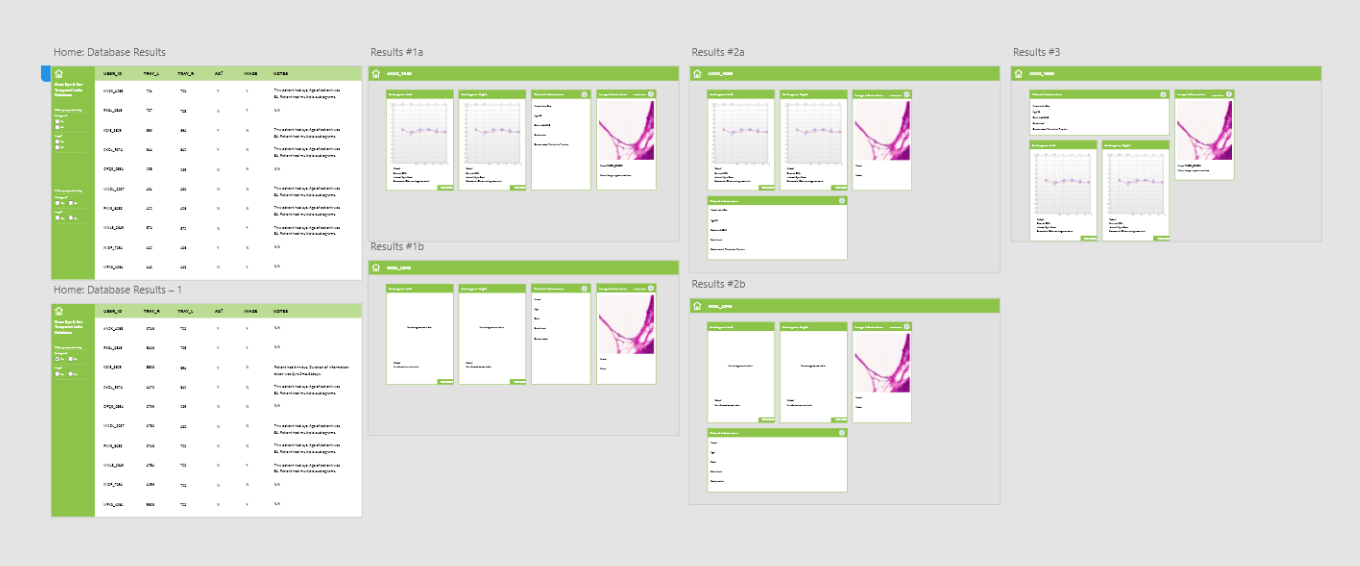
Work I completed at my past co-op. I spent 6 months working on a variety of projects
ranging from small data munging applications to full stack development for a platform
that will be used by the entire company.