Curious Boston

Winner of the Data and Digital Storytelling award at RISE 2020

September-May 2020

A team of researchers who worked with the City of Boston and community based and advocacy organizations to better understand the data needs of these organizations.

me

The Process

Our research this semester has focused on the Boston Open Data Department and their interactions with different community and advocacy organizations in the Boston Community. Through meetings with several different community organizations from a variety of sectors as well as brainstorming, prototyping and check-ins with the head of the Boston Open Data department, we identified several pain points and inefficiencies in the data flow — mostly concentrated between Data.Boston.Gov and the community and advocacy organizations they are trying to serve. You can see our research findings on the city’s data process mapped out below, as well as supplementary information on key stakeholders and insights from some of the organization leaders we spoke to.


Team Goals + Interests

Initial Goals

* Making a real impact on informing the Boston community on data and data usage
* Creating something that people can use
* Ensuring accessibility of the final project


Potential Ideas of Interest

* Allowing communities to learn from within
* How to inform the general public about data security
* Accessibility to data and how it is being used


Research Plan

Research Questions

* Are Bostonians curious about data?
* What are Bostonians curious about regarding data?


Research Hypothesis

Bostonians are curious about data but don’t have the means to ask questions about it. Additionally, people don’t know what questions to ask.


Goals of Project

* Find out Bostonians’ curiosities regarding their data and city data
* Reveal (and increase) curiosity about data
* Present the concept of data in a positive light
* Create (and streamline) processes for the city to help (and solve) data curiosities


Initial Research

The General Idea

To model our idea of getting people to ask the right questions, we created a vending machine with inputs and outputs to get people to ask better questions.
* Inputs: Question about data
* Outputs: Better question about data


How it Worked

The person would ask a question related to their neighborhood and data. The vending machine would consume the question, and ask a question in return to help the person ask a “better question” denoted by the criteria below. The person would ask an improved version of their question until they successfully asked a “good question” deemed by our standards. The machine would then celebrate this with a showering of confetti.


What is a Good Question?

* Productive: answer can be used to provide a solution to problems
* Specific: have limited possible answers
* Quantifiable: Kim can offer data resources to inform solution
* Relevant: related to the data that the city can provide
* Purposeful: include why the person is asking the question


Prototyping


me


We went through all of our possible prototype ideas and grouped them by idea and goal. Here are some rapid storyboarding sketches of possible prototypes.


Final Prototypes

01 Web Application

Users would input basic demographic information on themselves and leave questions on this digital “wall” that Kim and other data stakeholders could later look back on to direct future department efforts and community outreach.


02 Data Representatives

A person (probably one of us) whose job it is to answer and collect questions residents ask at specific points of interest. A similar example of an already existing representative could be the MBTA officers that stand on the subway platforms.


03 Question Wall

Question walls are large surfaces (typically sides of buildings) at street level that pose a question to people that pass by. Attached to the wall are writing implements for people to write their answers on the wall itself. The status of the wall and the answers on it are catalogued at regular instances.


Prototype Results

Goal

We aimed to use the responses to each question as a gauge on how successful each question was in garnering the information on the opportunities for Kim to direct future department efforts and community outreach.


Methods

We came up with 5 questions to ask through a google form
* I think data is ____
* I think data should be ____
* I want to know ____ about my neighborhood
* My neighborhood needs ____ to help ____
* I want to help my neighborhood by ____


Results

* 10 Google Form Responses
* Provided insight into what makes a successful question
* Prototype was related to imagined final product, but was not an exact representation of it
* 10 responses was helpful, but not a view into or representation of the whole city


Transitioning

Why?

After conducting our first prototype, we realized that our target audience was too broad. Having all Boston citizens be the audience resulted in a very varied interest in data and goals. We checked in with Kim, and decided to narrow in on community organizations that may already be dealing with data or would like help accessing it.


New Team Goals

* Figuring out what data Boston organizations are interested in
* Creating a framework that they would find useful in asking for that data to make them self sustainable
* Streamlining processes for Kim to make data more accessible to the community.


New Area of Interest

Creating a reusable platform for organizations to ask the city for data.


Revised Research Plan

Research Questions

* What would Boston-based community, non-profit, and research organizations want from a platform that allows them to ask the city for data?
* How might we align that with what Kim and the Boston government want from the platform?


Research Hypothesis

Organizations want data and access to data, but don’t always know where to start looking and/or how to ask for the data.


Proposed Solution

A web-based platform that community, non-profit, and research organizations can use to ask the city for data.


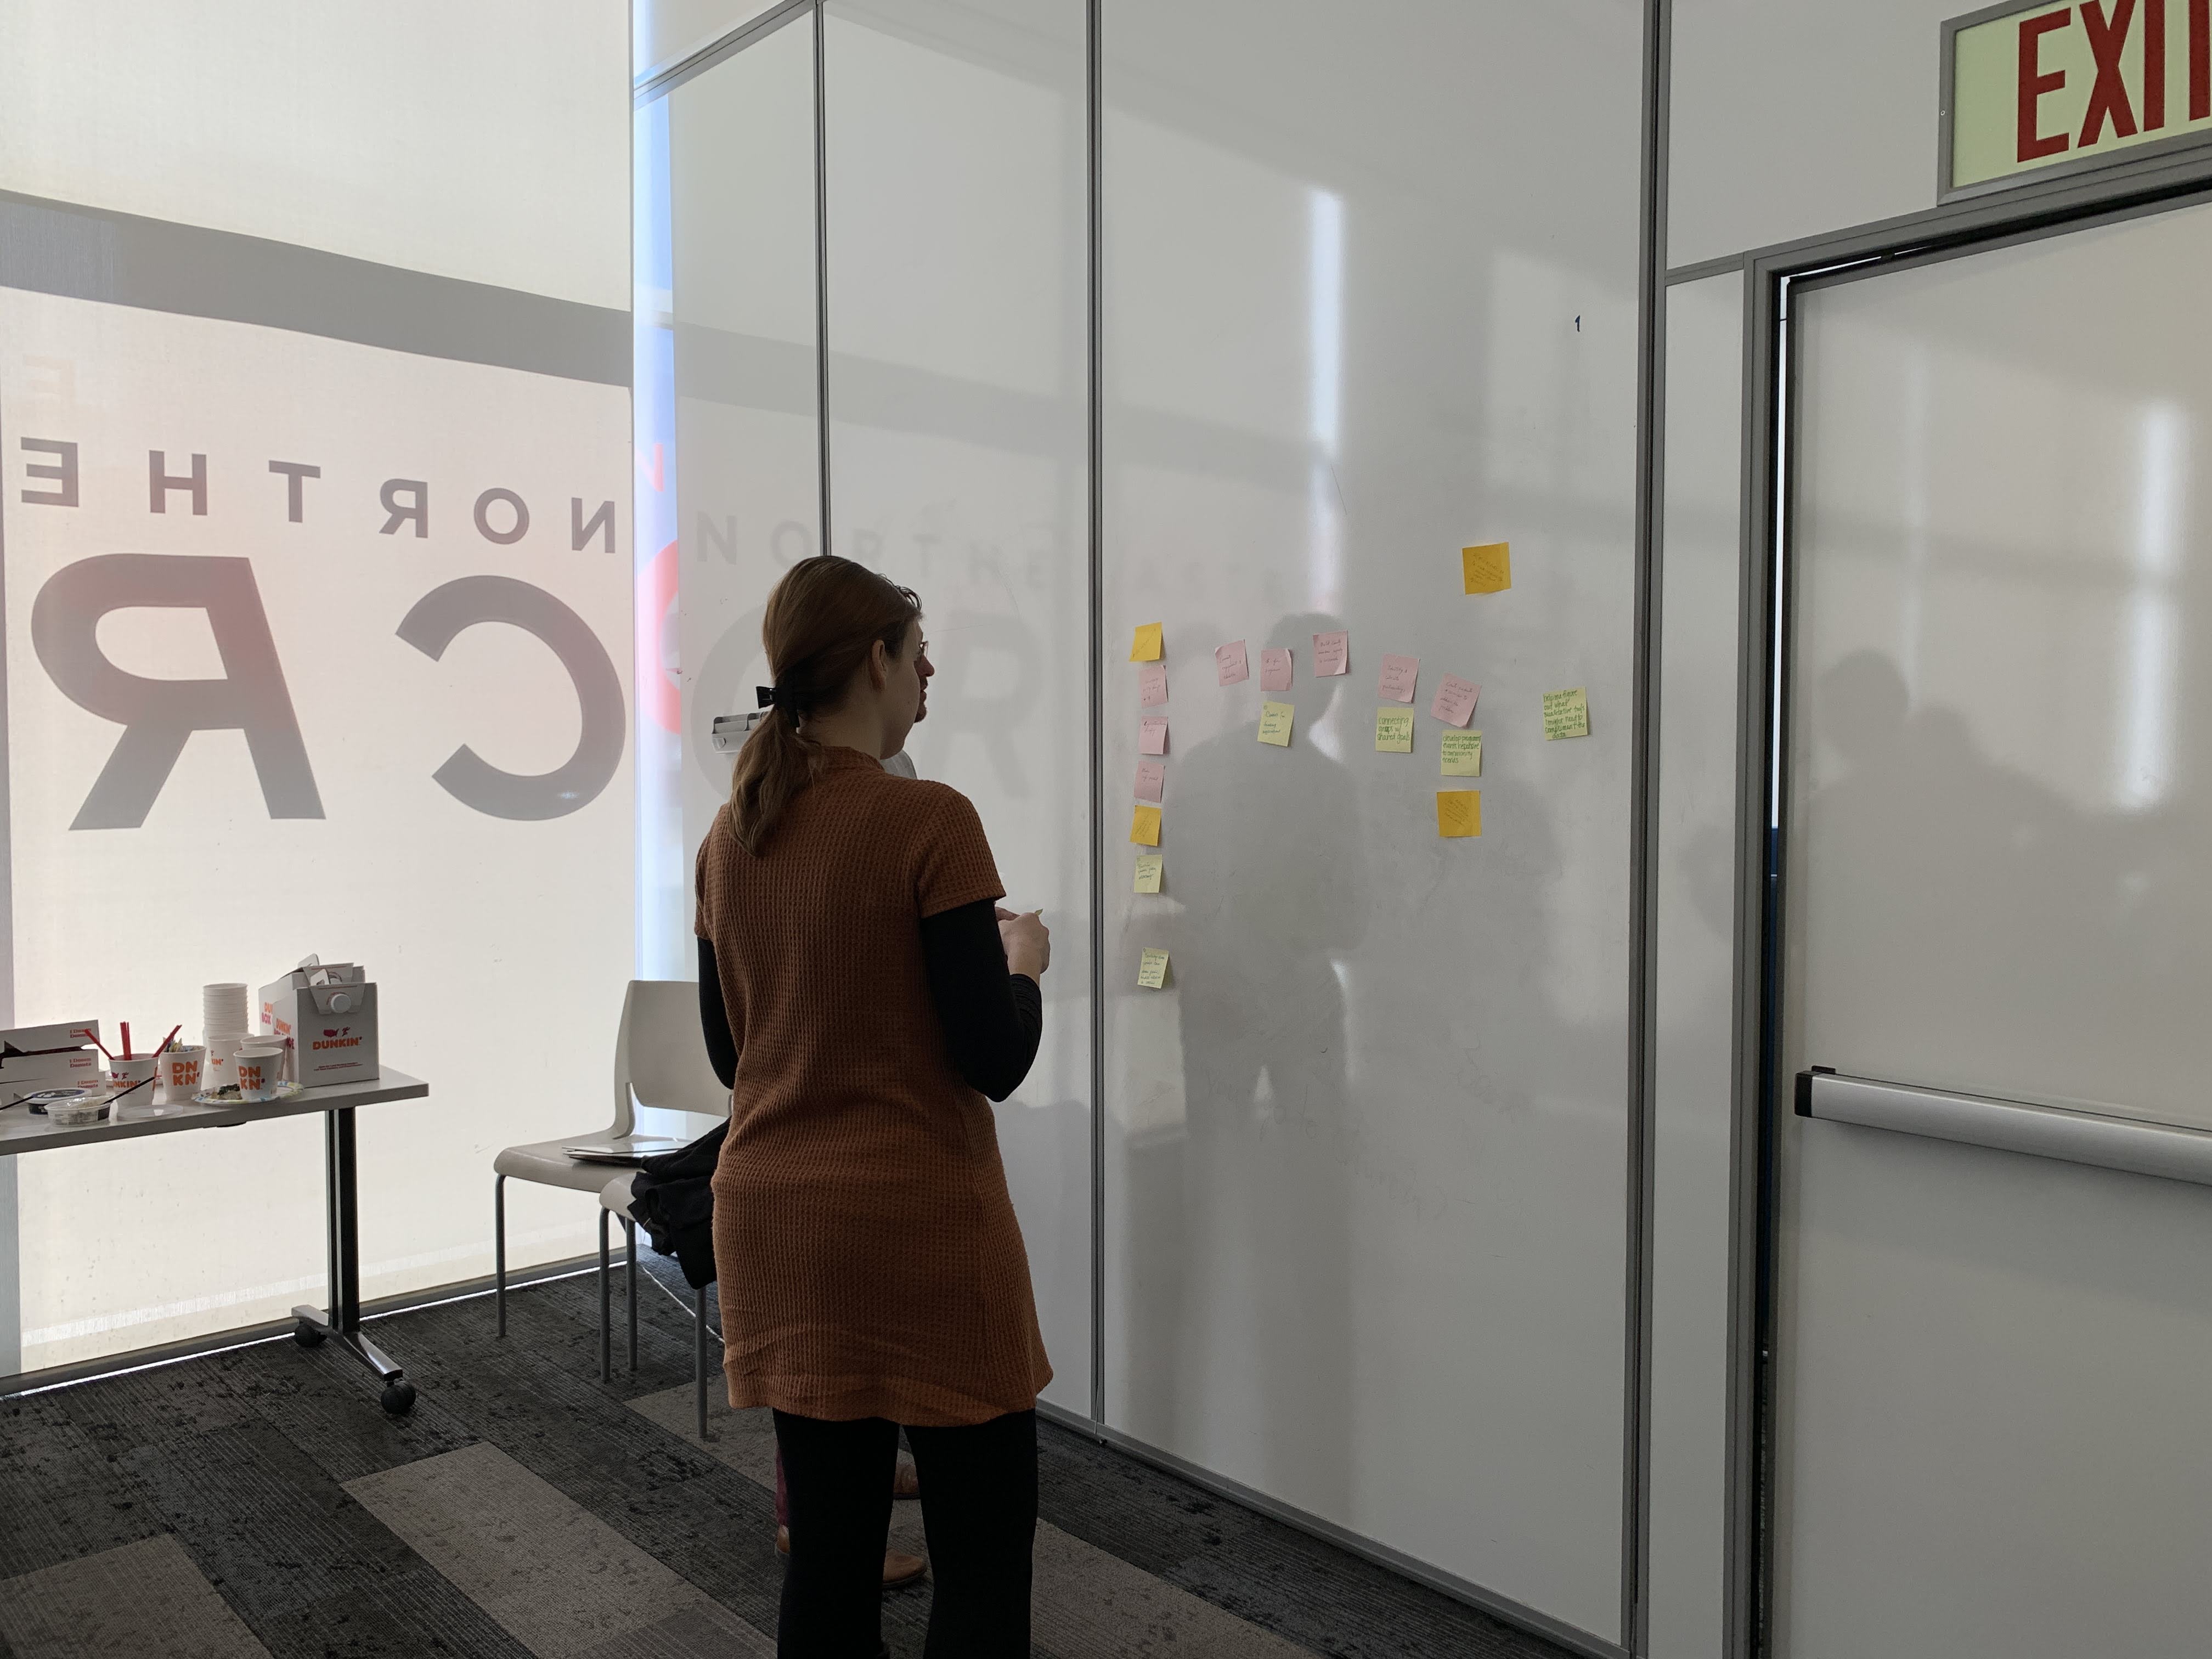
Interviewing Community Organizations


Over the course of a few months, we were able to interview people from the Boston Area Research Initiative, Asian Women for Health, LGBTQ Youth Organization, and the Boston Public Health Commission. Through these interviews we were able to better understand how each organization deals with data and were able to identify specific pain points. After interviewing, we found that there is a big gap between the City of Boston and the community organizations in terms of analyzing and understanding the data that is being provided. We compiled this data into our gigamap!


Web Prototype


me


me


After analyzing the interviews and brainstorming ideas for the prototype, we decided on a mad libs style search page for the City of Boston data portal. This would allow organizations to have an easier way to search for datasets by asking better questions.


Event Planning


me


Purpose

After completing research last semester, we realized that many organizations would benefit from face to face interaction. This semester, we set off on a journey to plan two events. Unfortunately, we were only able to run one event, as the other was cancelled due to COVID-19.


Goals

* How do organizations use city data?
* How would organizations like to use city data in the future?
* Generate meaningful conversation at each event
* Provide a space for skill sharing
* Connect organizations to each other


Event 01


me


Overview

We planned for our first event to be small and intimate and at Northeastern Crossing, a public space that can be booked my almost anyone! We posted our event on eventbrite, and sent invitations to any organizations we had reached out to as well as new organizations.


Agenda

* Introductions: getting people comfortable and establishing the purpose of the event
* Boston Area Research Initiative Data Training Session: We had a researcher from BARI come in to give a brief overview of a data mapping tool that organizations could explore
* Interactive Data Activity: We organized an activity for organizations to learn from other organizations for how they approached challenges with data


Event 01 Feedback

Survey Results

After the event, we provided questionnaires. We found a few things
* Most people were comfortable interpreting data sets but not analyzing them
* Most organizations don't have the resources or time to send people to get trained in data. They are looking for people to do that for them.


Retrospective

For our team retrospective, we found a couple of things to improve upon.
* Spend more time explaining our research
* Focus on networking and person to person interaction
* Give more context for everything we may be presenting


Event 02

Overview

Due to the COVID-19 outbreak, we were not able to host a second event. Here is what we might have planned.


Presentation

* A high level overview of our research
* Walk through use cases of City Data and how they are translated into projects
* Have a representative from the City of Boston attend the event


Networking

Throughout our first event, there was a lot of networking that was successful. For this event, we would build on that with a more dedicated set of time for networking!


Ideas for the Future


We are packaging up both the prototype and the event content for the City of Boston to hopefully implement over the coming years. We hope that the integration of our UX research into the City of Boston data portal will help community organizations have better access to the data and resources they might need to reach their goals.

Next Project: Decibel Therapeutics

let's get in touch!